Projects
Some Personal Projects
Parts Listing App
I designed this program to help keep track of the different integrated circuits (ICs) that I had. The major issue with having a multitude of ICs is that you forget what the model number means for the functionality of the ICs. Also, having a program to catalog small components helps keep track of the number in stock and where they might be located if they're needed.
To add an item to the listing, the user simply adds the name and other information into the boxes on the first row. The user then click the "Add to Listing" button. This will added the part and information to the listing and the part will be assigned a code number. This code number allows for the part's information to be editted or deleted. The user can the edit the part's information by entering the code into the entry box on the second row and entering the desired information to be replaced in the first row and simply clicking the "Edit Part Data" button. The user can delete a part by entering its code and then clicking the "Remove from Listing" button. The parts can also be sorted alphebetically by the category or the part name. On the far right of the second row, there is a box and some arrows pointing left and right. These are for changing the page number of the displayed items.

Data Converter App
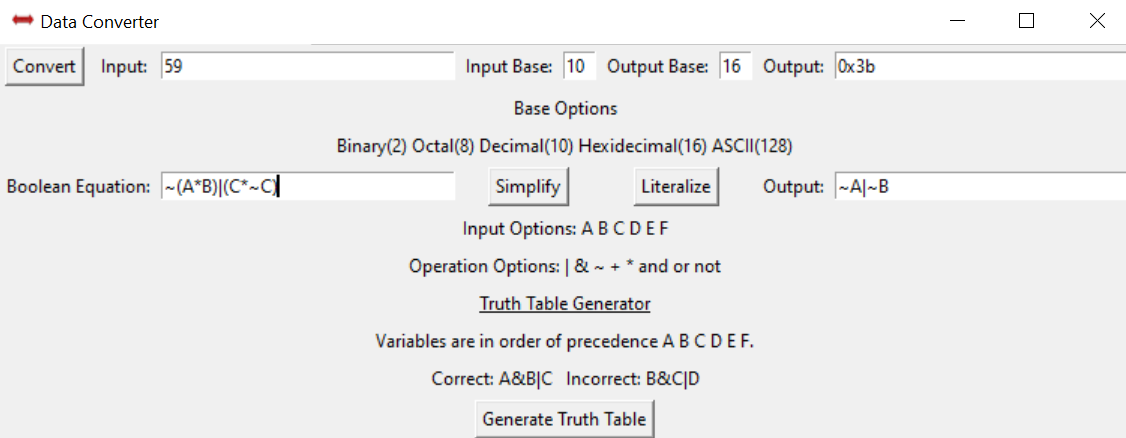
This program was designed to help accelerate design processes in labs or other projects that required digital data conversions and boolean equations. Although I could do all of these conversions myself, this program helped speed the process of decoding vast sums of digital data that would be used in complex binary simulations in programs such as ModelSim.
The application can at max convert a string of 128 characters of hexadecimal values. This means the application can take in large data values and the input and output bases are flexible. So, the user can enter in a binary value and get out an ASCII character or the user can enter an ASCII character and get out the hexadecimal value of the character. The application can also take in boolean equations and literalize or simplify the equations for up to 6 different variables (A & B & C & D & E & F). This is very useful for optimizing digital circuits and refining and omitting components in the design. The literalize function simply applies Demorgan's Theorem to the equation. The simplify function applies Demorgan's Theorem and then reduces the equations on the basic boolean algebra axioms. The final functionality of the Data Converter is the truth table generator. The user will enter a boolean equation and then press the button to generate a truth table based on the boolean equation. This is also especially useful for debugging digital circuits, as it can help point out incorrect behavior of one of the boolean variables in the users' circuits.
Sam Snip App
This application was made to simultaneously save cropped and screenshotted photos to a specified directory. This was created due to the fact that it was very time consuming and tedious to snip an image and then surf the directory back to where the previous photo was stored and then proceed to name it in some chronological order. This application was made to reduce the time required to complete the redundant task.
The use of this application is pretty straight forward. The user must simply open the application above the desired area they would like to screenshot and then click the "Snip" button. This will turn the application transparent and record the screen so that the user can then crop them image by click two points of the image. The user then can either save the snip as a single image or check the "Autosave" box and select a destination for the image(s) to be saved. The "Select Destination" button simply provides a graphical directory to use. If the "Autosave" box is checked, the images will be automatically saved to the destination folder and then either named by the date and time of the image or by the number. The two options can be selected by the "Naming Convention" dropdown box. The saved image's directory and name will be displayed in the far right box of the application.

Some School Projects
C Coded Applications
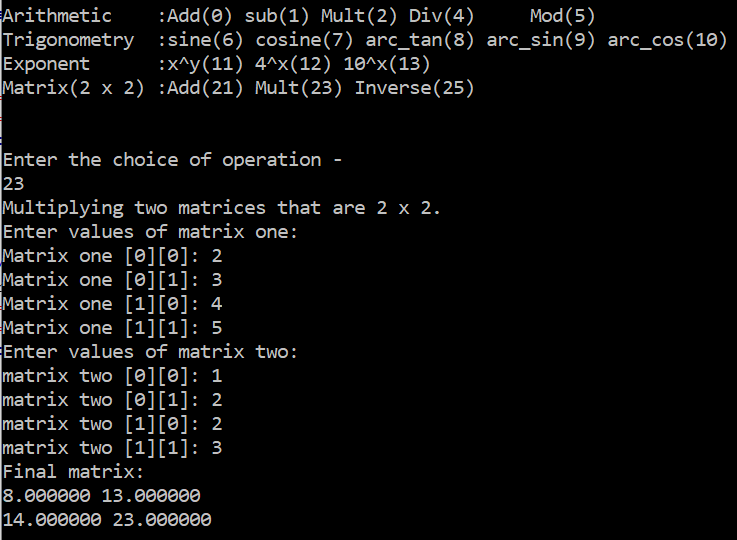
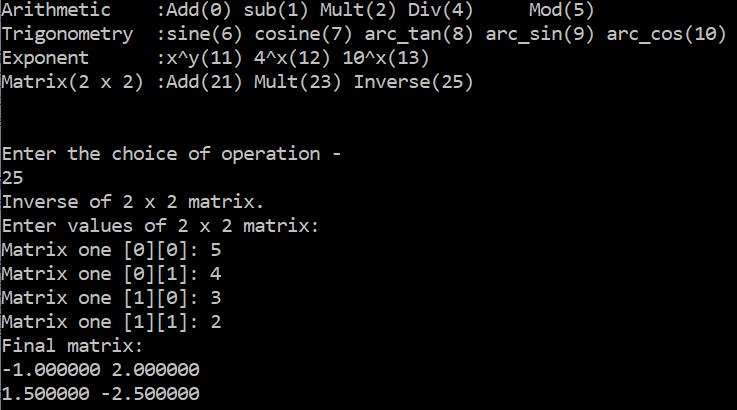
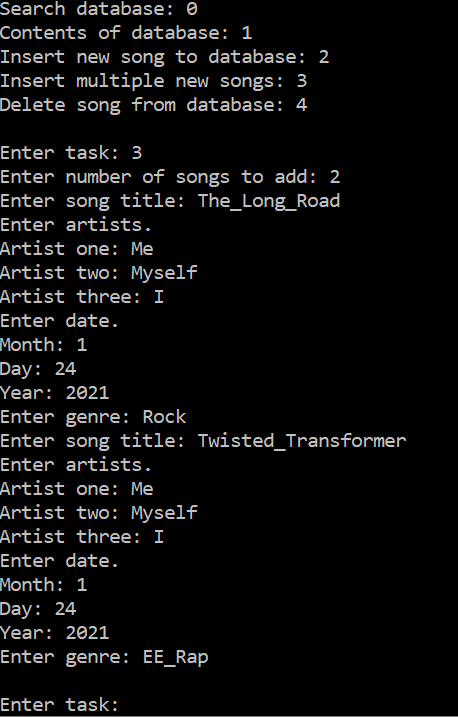
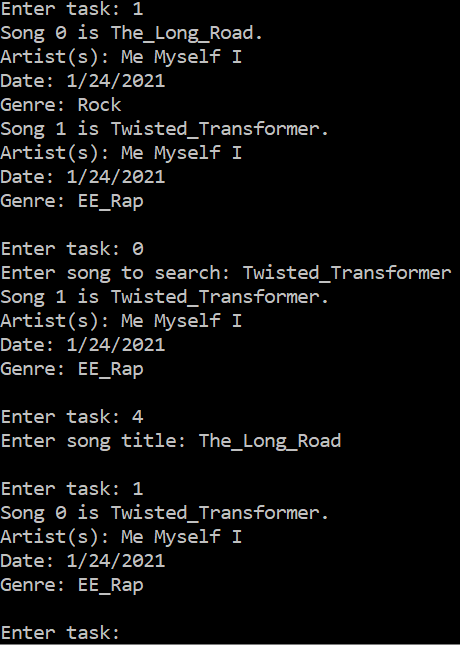
For my Problem Solving Methods and Tools for Electrical Engineers course, I got to create the opportunity to create a calculator and a music player database using C code. For this course we also used C to filter images, edit images, play music, and filter corrupt audio files. This course taught me the speed and power of C due to its low level nature.
For the calculator application, the user enters a number between 0 and 25 to select a function. The calculator then prompts the user to enter in the variables needed to calculate the function. The calculator can even add, multiply, and invert 2x2 matrices. For the music player application, the program allows the user to store a song or multiple songs based on the name of the song, the artist(s), the data, and the genre. The user then can search for the song in the database by the song name, show all the songs in the database, or delete a song from the database.
Games Created in Java using Data Structures
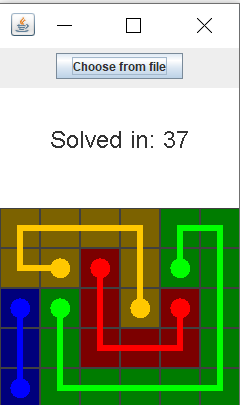
For my Data Structures course, we used the Java coding language and data structures to create some minigames. One of the games I created was Flow. This game starts with eight dots consisting of four different colors. The objective of the player is to trace a line from one dot to another dot of the same color. This can be challenging because it isn't clear to the player how to match the dots together all at once. Connecting two dots incorrectly will require the player to retrace them and get a reduced score. The score at the top is based on the amount of time it takes the player to complete the game. New games with different dot locations and matrix sizes can be selected using the "Choose from file" button at the top of the window.
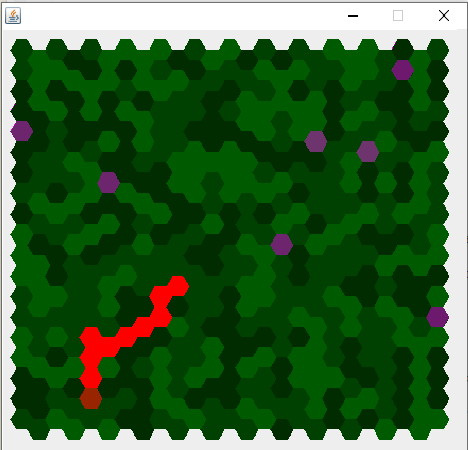
The other game is called the Snake Game. For this game, the player starts with a snake with a length of four. The player then controls the direction of the snake by moving their mouse in the direction relative to the snake. The goal of the player is to eat purple bits of food. Except, there are also purple bits that move on the map called crabs. The player must avoid eating any of the crabs or they will lose the game. For each piece of food the player's snake consumes, the snake gains a length of one and becomes slightly slower. Also, a new crab is spawned for each piece of food consumed. So, the example image has six purple crabs, one food, and a snake with a length of ten. The player scores by the number of food the snake can consume without running into a wall or consuming a crab.
NOAA Module using Digital VLSI
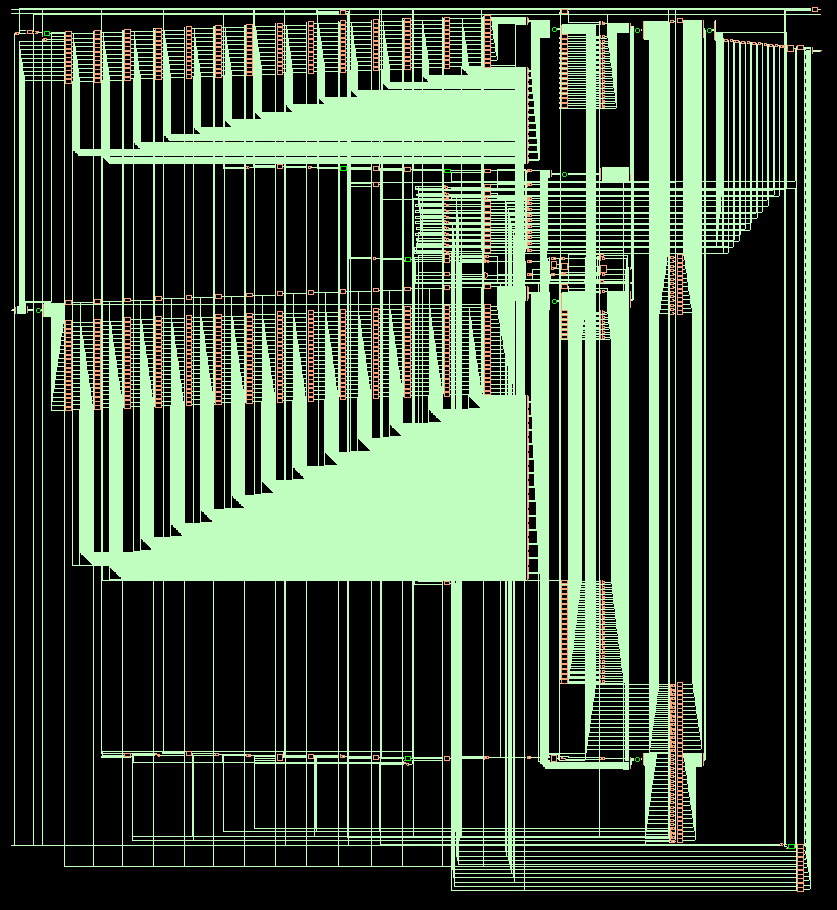
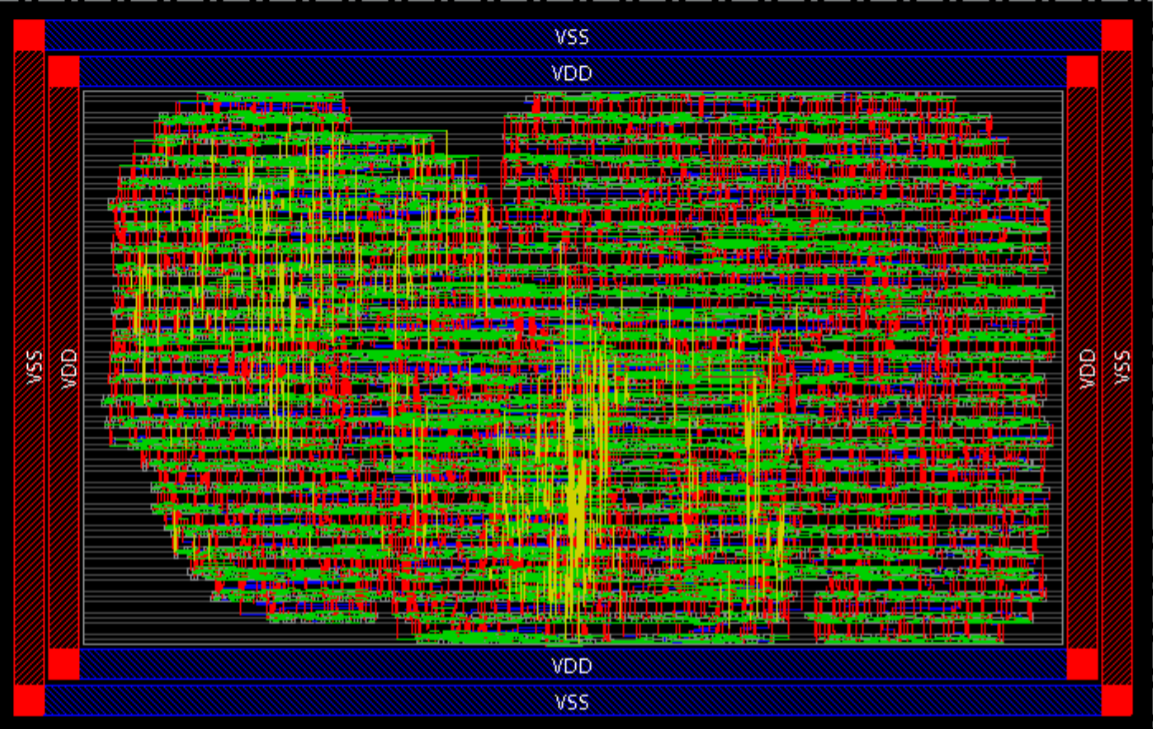
For the final project of my Digital Very Large Scale Integration (VLSI) course, I worked with a group of students to create an Application Specific Integrated Circuit (ASIC) that would take in fourteen different twelve bit temperature values and output the average or standard deviation of the temperatures. The circuit conducted all of the calculations with MOS devices rather than with software. We used the System Verilog coding language to design and simulate the NOAA module in Modelsim. We then used Cadence's Innovus to place and route the transistors and power into an ASIC design. I designed the layout of the lower level components for the majority of the final design. It was interesting to see how an engineer can efficiently create everything from nano scale layouts of components to entire systems to create ASICs.
MIPS Processor with Data Dependency Handling and Pipelining
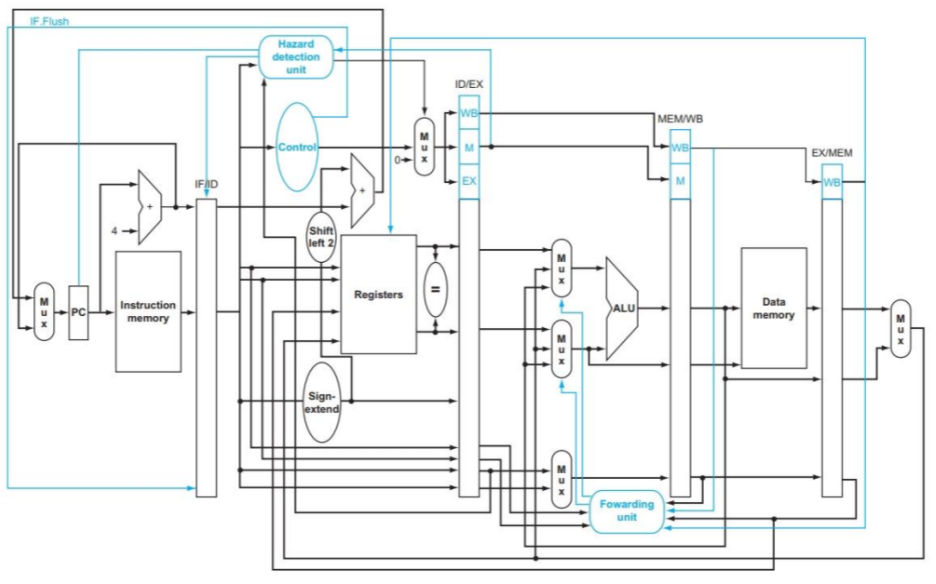
For the length of my Computer Organization and Design course, I got the chance to build a MIPS Processor using VHSIC Hardware Description Language (VHDL). I used Modelsim extensively to test the code of the design. Each instruction had to be implemented and tested individually for almost every test case. I loved learning how straight forward adding another instruction to the processor was. As my professor always said, "Just add a mux!" Once we had implemented a processor that could implement all the instructions, we then were tasked with making the processor pipelined. This allows the processor to run multiple instructions simultaneously. However, the instructions that had data dependencies were required to wait some amount of clock cycles using instructions called No Operation (NOPs). The semester's length had been shortened by two weeks, so this was all that we were required to do for the course. However, the professor had put out a challenge for those that could create data dependency handling for the processor. I really enjoyed the satisfaction of creating the processor, so I decided I would accept the challenge and implement the data dependency handling. I added a hazard that would halt the processor and a forwarding unit that would forward processed data. I accounted for about a dozen different data dependency cases so that the processor could run all the basic instructions without requiring NOPs.
Solid State Temperature Sensor and Bandgap Voltage Reference
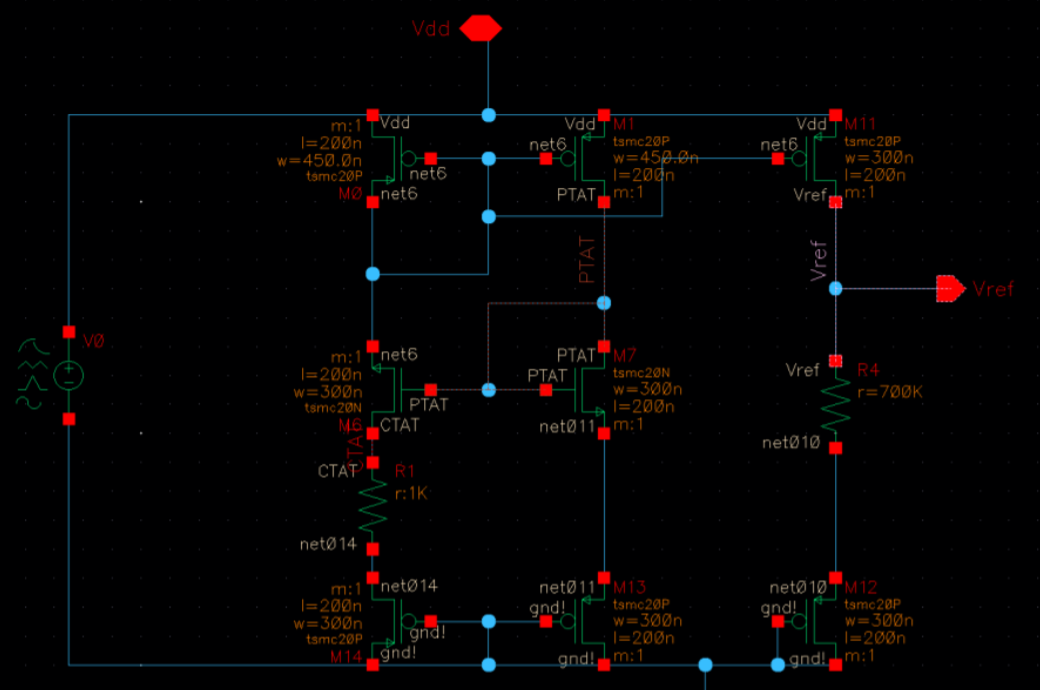
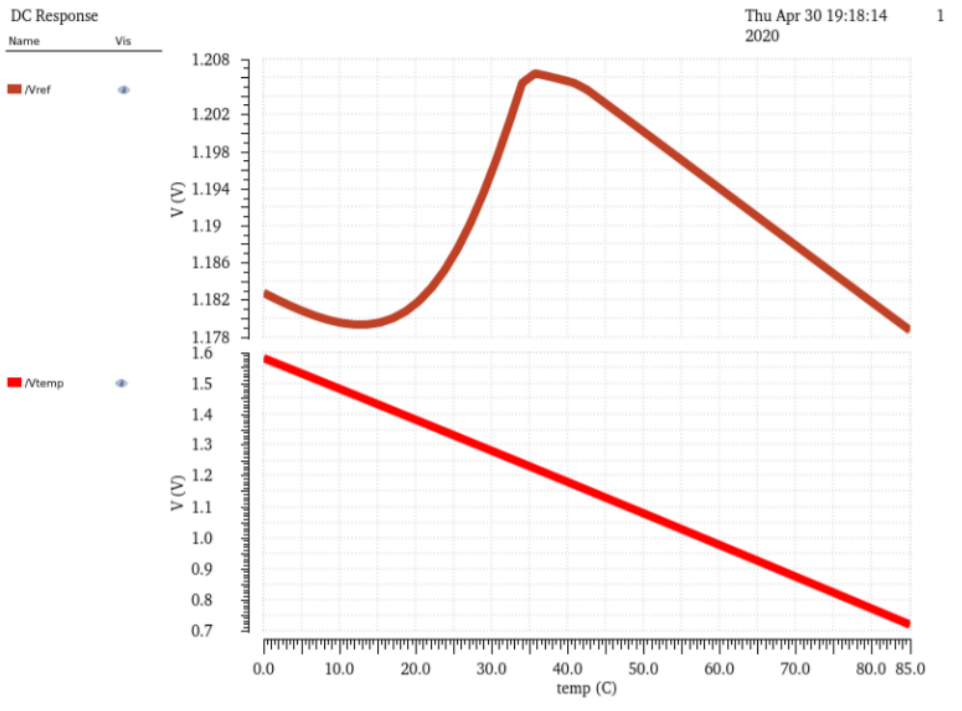
For the final project of my Integrated Electronics course, I decided to create a temperature sensor using Cadence's Virtuoso. The sensor needed to have a component that would have a constant output voltage that was independent of temperature change and would remain within 5% of the specified 1.2V. The sensor also needed a component that would change linearly with a temperature range of 0-85 C and a voltage difference of at least 350mV. For the temperature independent component, I used two opposing current mirrors that would offset each others' voltage as the temperature changed. The device configurations are known as PTAT and CTAT in industry. For the temperature dependent component, I used two PMOS transistors in the diode configuration and in series to amplify the voltage change with respect to temperature. The voltage was then amplified by a single supply non-inverting amplifier. My device significantly surpassed the project requirements by only varying 2.3% versus 5% of 1.2V for the temperature independent component and ranging 900mV versus the required 350mV for the temperature dependent component.
MARS Rover Project
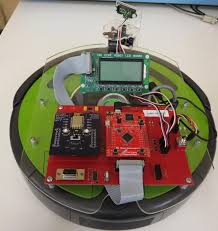
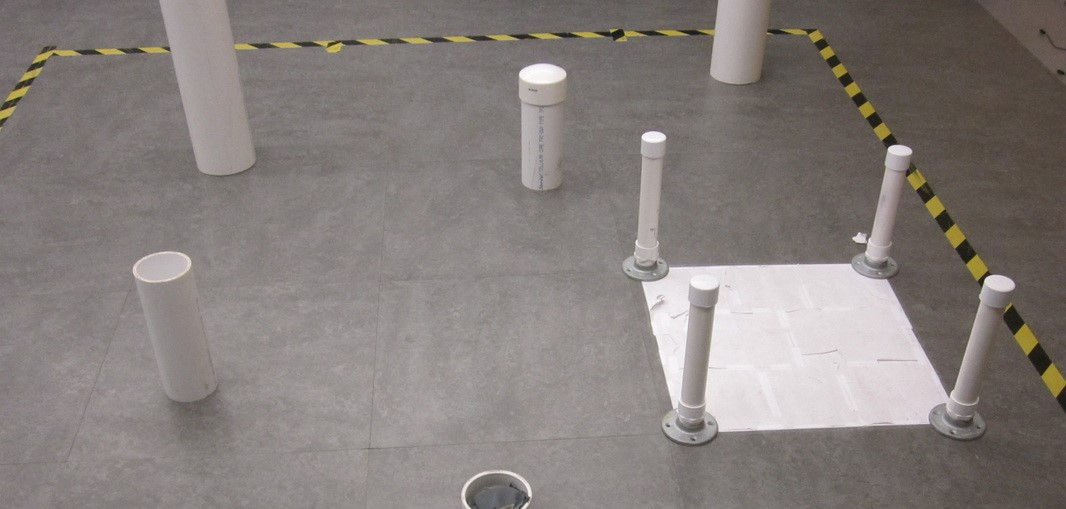
For my Embedded Systems course, we got to program a TI Launchpad that was interfaced with a Roomba and multiple other sensors. Over the course of the semester we worked with interfacing and processing sensor data for ultrasonic sensors, infrared sensors, and rotary decoders. With the experience we had gained from working with embedded systems and sensors, we were tasked with navigating the Roomba through an obstacle course blindly and stopping the Roomba on a designated square surrounded by four posts (the white square in the photo). The Roomba and the obstacles would be placed randomly in the course. The Roomba would then either need to be blindly remote controlled from a control station or it could navigate the course autonomously. Me and my partner worked tirelessly night after night on perfecting our algorithm for navigating the course autonomouslly using the sensors we had. We of course had a backup application to control the Roomba from the control station in the case the algorithm was too slow to find the goal. Thankfully we never had to use the control station because the navigation algorithm worked exactly as planned and landed in the goal entirely autonomously. We were the only group to complete the course autonomously that semester.
Senior Design Project - Frequency Response Analysis Device
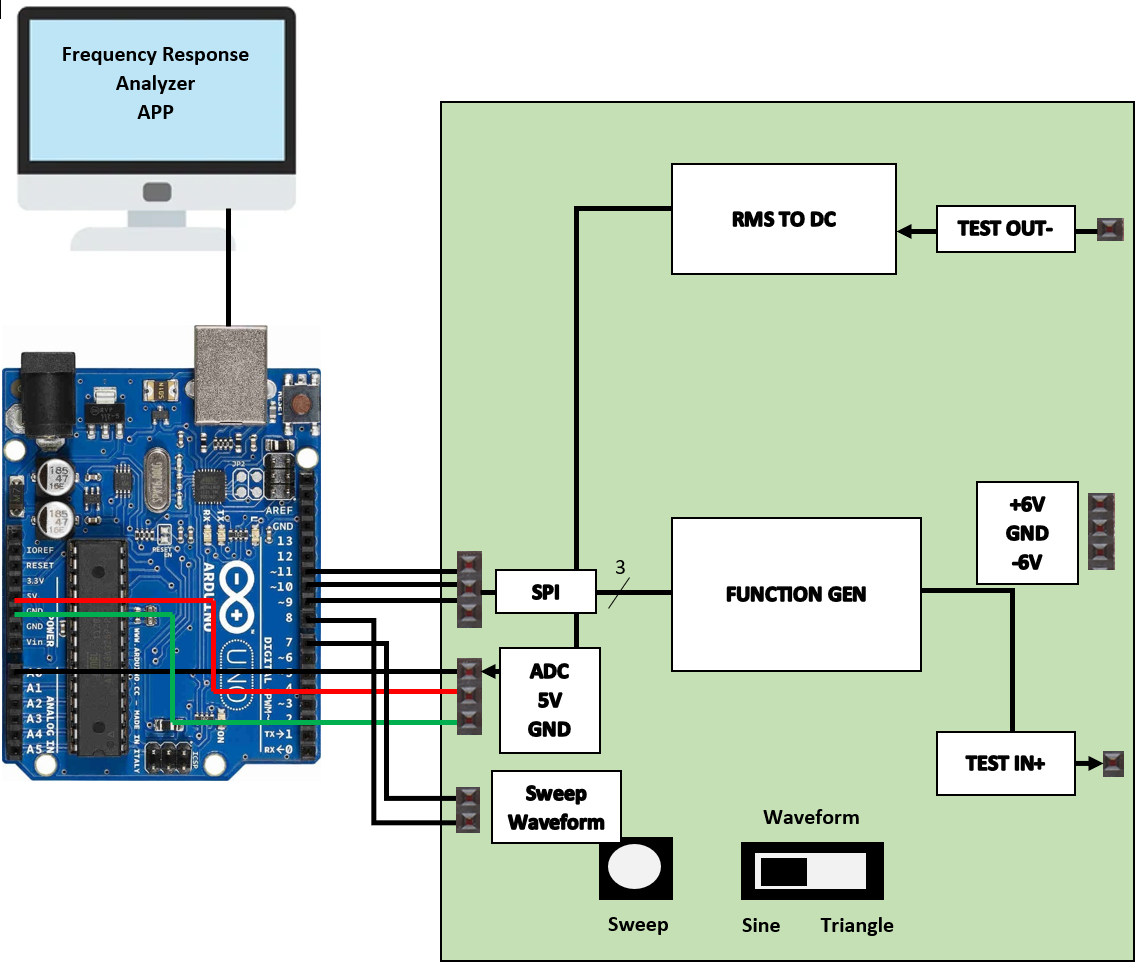
For my senior design project, my group was tasked with creating a device that could analyze
the frequency and phase response of filter circuits. The design needed to be simple and cost
effective so that it could be used by students at home during the pandemic without forcing
them to purchase expensive lab equipment.
For the implementation of the device, we started by designing the function generator module
using the AD9833 IC. Before we designed the module, we did extensive research through the
data sheets provided. The AD9833 IC was a digital application specific IC and was quite
complicated to learn how to program with it’s proprietary programming message formats. We
learned how to use the SPI serial interface, different bit placements, and data conversions for the
IC. We used a testing schematic given to us on the datasheet for the function generator and tried
programming it using an Arduino. Programming the AD9833 was the most time consuming
portion of the project as it was hard to learn the bit placement of the programming messages with
few examples online. Once we figured out how to program it to create a specific frequency and
waveform, we needed to figure out how to constantly reprogram it to sweep through a range of
frequencies. With some more research and testing, we were able to figure out how to reset the
function generator and reprogram it for a different frequency quickly and easily.
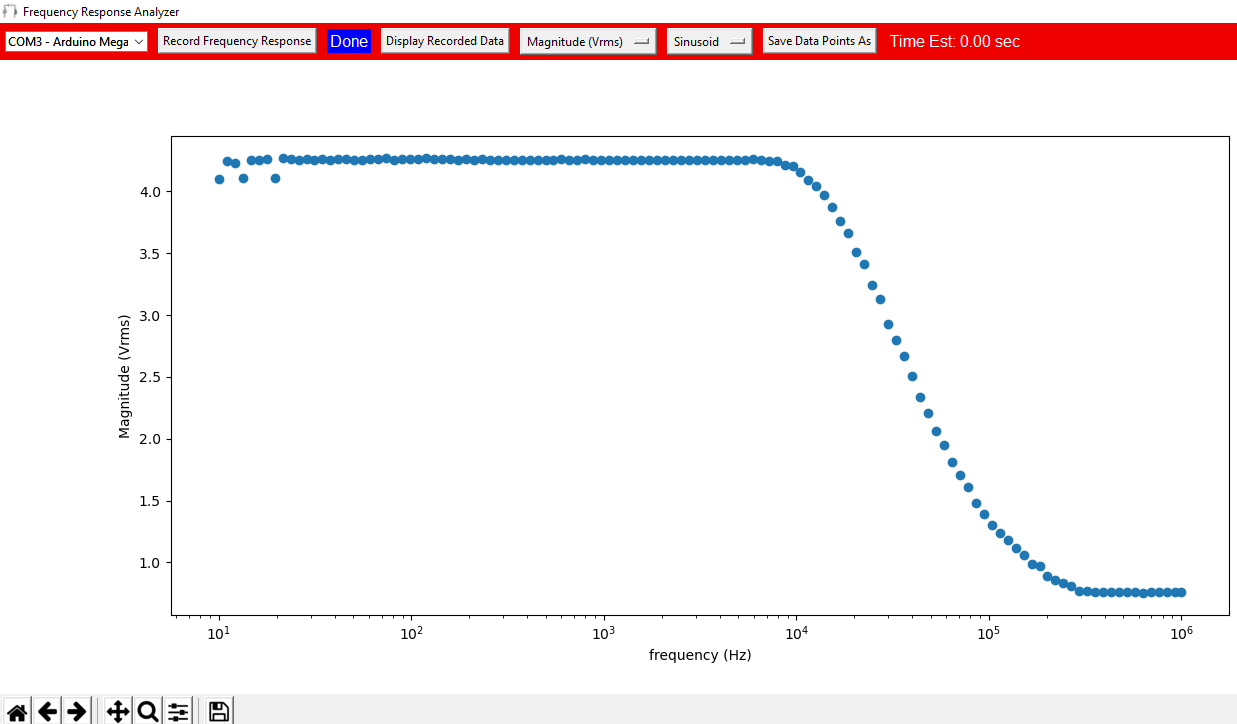
Once we completed the function generator module, we started to work on a prototype Python
application that would take a CSV of recorded data points and display them on a plot. The
prototype mostly consisted of the graphical user interface (GUI) and did not include the time
estimation indicator or the status indicator. Once the GUI was designed for the application, we
created an Arduino application that would serialize ADC values of a given voltage and send it to
the PC. For this portion of the design we added a flag byte to each serialized message of 0xC0.
This flag would indicate that the message was correct and complete. We then programmed the
Python application to read the serial port and get the correct serial messages. The messages
were then calculated into actual voltage values based on the ADC range of 5V.
Now that the Python application could sample the magnitudes of the Frequency Response
Analyzer device, we could start to design the RMS to DC converter module. We started the
design by creating a sample test circuit from the AD8436 datasheet. Using a lab function
generator, we tested the module with different magnitudes and frequencies to see the
corresponding DC output voltages. Luckily the device had little to no offset with a coupling
capacitor to the RMS input of the IC. We decided that the DC output was accurate enough to
amplify itself instead of the function generator. We decided this because in order to amplify the
function generator we would need a negative supply and designing the circuit without a negative
supply voltage would be much simpler and cost effective since we wouldn't require a larger power
supply and additional components.
Once we had a working function generator module and RMS to DC conversion module, we then
could work on finalizing the software. Magnitude sampling was added to the frequency sweeping
Arduino code and the Python application’s frequency range was matched to the frequency sweep
of the function generator. Finally, all the modules for the device were complete and we began
system testing and implementation.
With the final testing of the device, we changed the plot from being linear to logarithmic. This
really helped eliminate the clutter of data points at the lower frequencies. We also added an
optional 9-12V battery supply that would allow the user to have +-4.5V or +-6V available for
testing active filters. We then tested some filter designs to make sure the device was recording
frequency responses correctly. The design was a success, so we began working on a PCB using
KiCAD. Unfortunately we were all new to using KiCAD and ran out of time to design and order the
PCB so that we could have a finished device.
Please check out my demonstration video!
Frequency Response Analyzer Device Demo
